
Electric Safety 1. Care will be used with all electrical devices around water. Use of electricity near water could result in electrical shock.2. All equipment will be connected to ground fault interrupt (GFI) equipped electrical receptacle. The student will work under adult supervision.
Tank Set Up
1. The fish are maintained in a 125 gallon planted aquarium with a sand substrate.
1. The fish are maintained in a 125 gallon planted aquarium with a sand substrate.
2. The tank is provided with numerous hiding places including natural rock formations and 1.5” diameter PVC plastic tubes.
3.The tank is maintained at a temperature of 74-78° F, a pH of 6 to 6.5 and salinity of 0.0 parts per thousand.
4. Two Fluval canister filters provide filtration.
5One canister filter contains activated carbon for removing dissolved organic compounds.
6. The second filter contains pelletized peat that maintains the pH of the tank.
7. Two 48” T8 fluorescent plant bulbs provide lighting.
8. The fish are feed daily with frozen brine shrimp, live brine shrimp, freeze dried tubifex worms or live grass shrimp.
9. Water quality is checked twice a week. A 25% water change is done weekly.
10. Identify the water level to be about 2-3 cm below the black plastic lip of the tank.
11. Add reversed Osmosis water to replace evaporated water.
12. To adjust the pH small amounts of vinegar will be used to adjust for acidic environment and small amounts of baking soda (sodium bicarbonate) will be used to create a basic environment. (pH-up and pH down can also be used.)
13. In the event that salinity levels change more water will be used to dilute the levels and more marine salt will be added to increase salinity.
Inserting Living Organisms
1. Place the container or bag in which organisms came in into the tank for 15 to 30 minutes. During this time they can be acclimated to the water temperature.
2. Add half of the tank water to the bag and reinsert the bag into the tank for another 15 to 30 minutes.
3. Release the organism and water into the tank.
4. Do not feed the organism for a day allowing it to get used to the environment.
Experimental Design
Measuring Electric fields
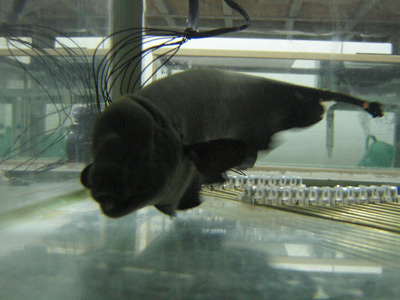
Apteronotus produces weak electric field of approximately 800 – 1200 Hz. These electric fields are measured using sensitive gold-coated electrodes, a pre-amp and an oscilloscope. The pre-amp is a Grass Model P55; the oscilloscope is Tektronix Digital TDS Model 2000
Dissolved Oxygen Levels
- Remove the digital Oxygen sensor and connect the probe.
- Remove the safety cap for the probe
- Turn on the system
- Calibrate the sensor by holding down the calibration button and turning the adjustment screw until the reading is exactly 100.
- For each tank, turn off the air stones and turn on the water circulation pump to move the water at 0.3 m/sec
- Place the probe in the tank about 10 cm from the water jet (make sure no bubbles are present for the water jet).
- Allow the LCD readout to stabilize and record your Dissolved Oxygen level in mg/L.
Aquatic Respirators:
- .Cut a piece of clear tubing with a 4.5 cm diameter, 20 cm in length
- Attach with a ring clamp solid PVC 10 cm in length.
- Drill two ¼ inch holes in the PVC section of the respirometer.
- Insert the electrodes into the holes and glue the electrodes to be stationary
- Cap both ends of the PVC
- Drill 1/8 inch holes in the cap and Insert the brass nipples.
- Connect a piece of ¼ inch aquarium tubing 18 inches in length to each brass nipple.
- Connect the water pump to the aquarium tubing (outlet jet)
- Connect another 18 inch piece of aquarium tubing to the water pump (inlet jet)
- To the Dissolved Oxygen chamber, connect two brass nipples to each side at different heights.
- Glue the brass nipples in place.
- Connect the brass nipples to the two remaining aquarium tubes.
- Drill a ½ inch hole on top of the dissolved oxygen chamber.
- Insert a doubled lined rubber washer and glue in place.
- Insert the Dissolved oxygen probe into the rubber washer.
- Turn on the pump and test for leaks.
- Seal all leaks with silicone sealer.
Data Collection
1. Place the fish in the aquatic respirometer.
2. Attach the electrode leads to the pre-amp to increase the signal strength.
3. Attach the electrode leads to ground 1 and ground 2 of the pre-amp and attach the output of the pre-amp to the input of the oscilloscope. The low and high filter of the pre-amp are set to 10 KHz with an amplification of 1,000X.
4. Wait ten minutes and begin recording data.
5. Turn on the aquatic respirometer by turning on the water pump and the oxygen probe.
6. Record the frequency of the electric field produced by the fish every minute for 30 minutes.
7. Record the starting and ending values of Dissolved oxygen.
8. Add a second PVC pipe and a second fish. Place the two PVC pipes 12 inches apart and record the frequency and dissolved oxygen levels produced by the fish every minute for 30 minutes.
9. Reduced the distance between the two PVC pipes by 2” and repeat the measurements for 30 minutes. Continue to reduce the distance between the PVC pipes in 2” intervals until the pipes touch and record frequency and dissolved oxygen levels data as described above.
Data Analysis
Descriptive Statistics:
1. Data will first be organized in a data table based on groups or variables.
2. The mean or average for each group or variable tested will be calculated.
3. Using an excel spread sheet the standard deviation for each group of variable will be calculated.
Correlations Calculations:
A relationship between 2 variables (oxygen consumption and electric field) identified.
1. The independent variable will be identified and be know as ‘electric field’ or x
2. The dependent variable will be identified and know as ‘oxygen consumption’ or y
3. x2 will be calculated for each test.
4. y2 will be calculated for each test.
5. xy will also be calculated and used to find the correlation coefficient (r)
6. Using the formula for the correlation coefficient, (r) is calculated
7. If the r value is close to zero, there is no correlation.
8. If the r value is close to positive 1, there is a positive correlation. As one goes up the other goes up.
9. If the r value close to negative 1, there is a negative correlation. As one goes up the other goes down.